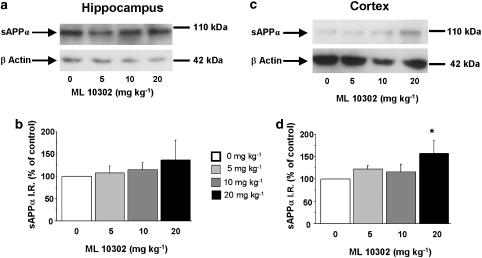
Figure 2.
Dose–response relationship of systemic ML 10302 administration on sAPPα levels in the hippocampus (a and b) and cortex (c and d) of 8-week-old male C57BL/6j mice. The mice received a range of ML 10302 doses (0, 5, 10 and 20 mg kg−1, s.c.) and Western-blot analysis was performed on sAPPα levels from hippocampal and cortical homogenates 90 min after the single drug injection. In (a and c) representative immunoblots illustrating the effects of increasing doses of ML10302 on sAPPα levels are shown. In (b and d), the mean densitometric values (±s.e.m.) of sAPPα levels, relative to β-actin (used as internal control) are expressed as percentages of values in untreated control mice. One-way ANOVA for hippocampus, F(2,16)=1; for cortex, F(2,19)=4.51. *P<0.05 compared with saline-treated mice (clear bar); least significant difference test; n=5 mice per group.

