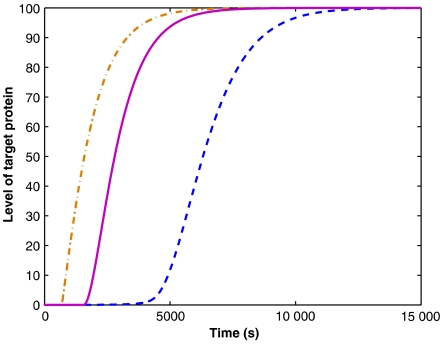
Figure 4.
Recovery of the target gene after the regulation is turned off. Shown is the level of the target protein (number of molecules) versus time: transcriptional regulation (dashed line), post-translational regulation by protein–protein interaction (dashed-dotted line) and post-transcriptional regulation by sRNA (solid line). When using the same parameters as in Figure 1, the recovery time in case of regulation by sRNA is faster than in case of transcriptional regulation, but somewhat slower than for protein–protein interaction. However, the recovery time depends strongly on the degradation rate of the sRNAs, and more weakly on the ratio gs/gm. Changing these parameters can result in a recovery time that is longer than the recovery time in case of transcriptional regulation.

