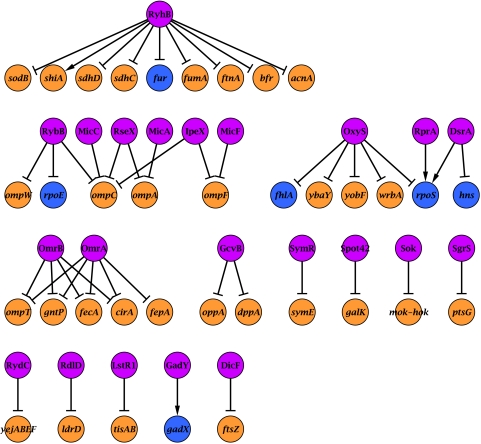
Figure 5.
The sRNA–target network. Nodes represent sRNAs and their targets (see Supplementary information for references). sRNAs are in pink, protein-coding genes in orange and genes encoding transcriptional regulators in blue. Arrows represent activation while truncated arrows represent inhibition.

