
Figure 4.
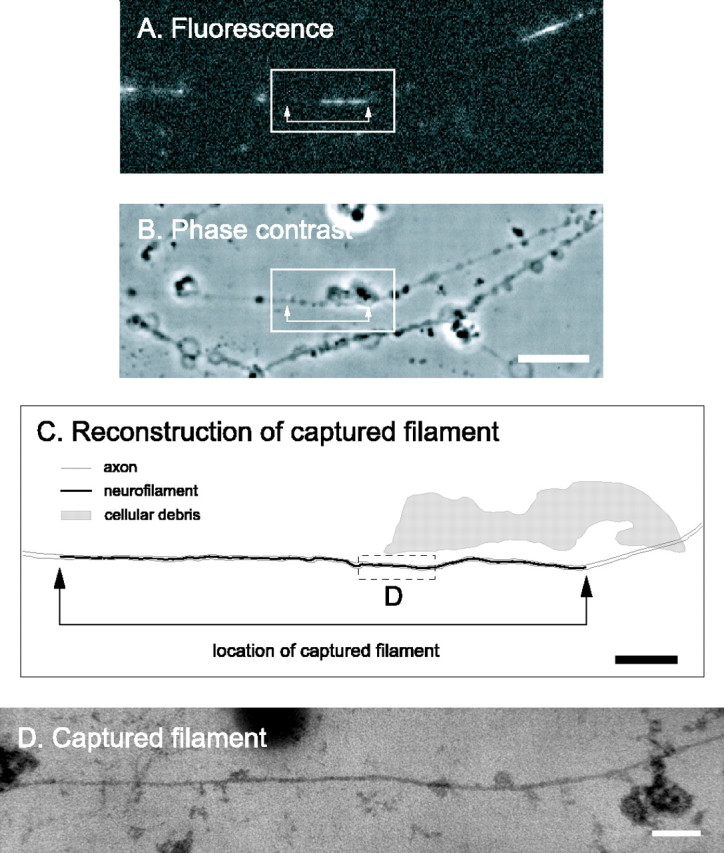
Electron microscopy of a captured filament using semithin sectioning. A, GFP fluorescence of a permeabilized axon before fixation, showing a captured filament in a gap. This filament was moving anterogradely at the time of capture. Proximal is left, and distal is right. B, Phase-contrast image of the same axon. The blebs along the axons are a consequence of the saponin treatment. Scale bar, 8 μm. C, Schematic line drawing of the axon and neurofilaments. The filament was traced from a montage generated from the digitized electron micrographs. Scale bar, 2 μm. The entire axon was contained within one semithin (blue/green) section that was the first to come off the block (i.e., the section immediately adjacent to the glass coverslip). The neurofilament is represented by the black line. This line was thickened to make the location of the filament visible; therefore, it is not to scale. The axon membrane was extracted for semithin sectioning (see below); therefore, the outline of the axon was drawn artificially based on the phase-contrast image and is represented by the gray lines. The shaded region represents a large piece of cellular debris, also visible in the phase-contrast image, which facilitated alignment of the fluorescence image with the electron micrographs. The arrows in A-C mark the ends of the filament. One end of the filament extended further in the electron micrographs than in the image of the GFP fluorescence, indicating that this neurofilament had not incorporated GFP-NFM along its entire length. D, Electron micrograph of the boxed region shown in C. The axon membrane is not present because we treated with 0.5% Triton X-100 after glutaraldehyde fixation to permit unambiguous detection of the neurofilament along its entire length. Note the continuity of the captured filament here, comparing to the discontinuity in ultrathin section in Figure 3. Scale bar, 100 nm.