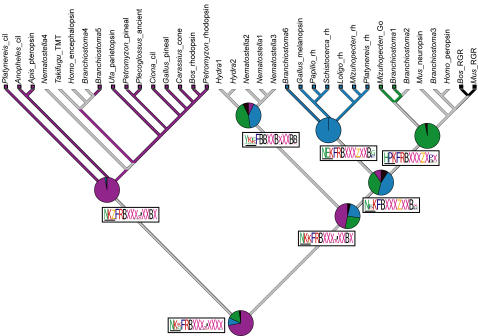
Figure 6. Ancestral state reconstruction of G protein-binding interactions for each metazoan opsin-mediated phototransduction cascade obtained by simulated mutational mapping [64] (see methods).
For each class of opsin, the P value of the reconstructed ancestral G α interactions is represented in pie graphs. Ancestral G protein interactions in phototransduction cascades mediated by ciliary, rhabdomeric and Go opsins can be significantly resolved (P>0.95) but the ancestral states of the rhabdomeric+Go, and cnidops clades are equivocal. ML state reconstructions shown for each node as colored branches. Red, Gi/t; Blue, Gq; Green, Go; Black, no G protein interaction (as is the case for RGR/Retinochrome opsins); Grey, equivocal reconstruction from ML. Reconstructed ancestral amino acid motifs of the 4th cytoplasmic loop region of opsin are shown along branches in logos. Maximum vertical height scales to P = 1.0. We obtained clear reconstructed states for most of the residues in a conserved tripeptide motif (residues 310, 311 and 312, horizontal bar) for the ciliary, rhabdomeric and Go /RGR nodes. For the most part, the remainder of the residues in can be unequivocally reconstructed to the level of Dayhoff classes. B = HRK, X = LIVM, J = GATSP, Z = DENQ.

