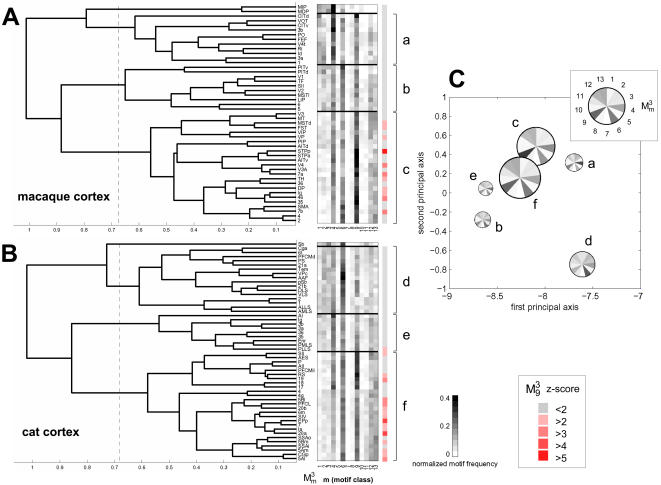
Figure 4. Hierarchical cluster analysis of motif fingerprints for individual brain regions.
(A) Dendrogram and clustered motif fingerprints for macaque cortex (top) and cat cortex (bottom). The dendrogram was constructed from the Pearson correlations between all pairs of motif fingerprints (normalized) using a consecutive linking procedure based on farthest inter-cluster distances. This results in a dendrogram with smaller distances for areas with more similar motif fingerprints. Stippled lines mark 2/3-maximal distance, at which cluster boundaries were drawn for subsequent analysis. Motif fingerprints for individual brain regions are arranged vertically by hierarchical cluster distance. Four distinct clusters per network are delineated and clusters with more than 2 members are marked “a”, “b”, “c” for macaque cortex, and “d”, “e”, “f” for cat cortex. (B) The average motif fingerprints for these six clusters are used to perform principal components analysis (PCA); a PCA plot spanning the two largest principal axes is shown. Average motif fingerprints are plotted as segmented circles, with circle size proportional to the number of contributing areas within the cluster, and motif classes represented around the circle (see inset). Note the proximity of several regional clusters with highly similar average motif fingerprints, especially clusters “c” (macaque cortex) and “f” (cat cortex).

