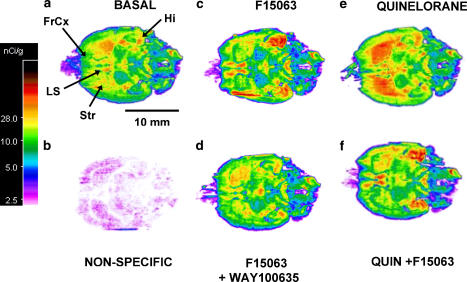
Figure 7.
F15063 exhibits dual 5-HT1A/D2 properties in functional autoradiography. Influence on G-protein activation in various regions of horizontal rat brain sections as determined by [35S]GTPγS autoradiography. (a) Basal conditions, that is no drugs; (b) non-specific binding was determined in the presence of 10 μM unlabelled GTPγS; (c) F15063 (100 μM); (d) co-incubation of F15063 (100 μM) with the selective 5-HT1A receptor antagonist, WAY100 635 (10 μM). (e) Quinelorane (100 μM); (f) co-incubation of quinelorane (100 μM) with F15063 (100 μM). The lower end of spectrum (blue/pink) represents the lowest G-protein activation while the upper end of spectrum (red) represents the maximal response. Abbreviations: FrCx: frontal cortex; Hi: hippocampus; LS: lateral septum; Str: striatum.

