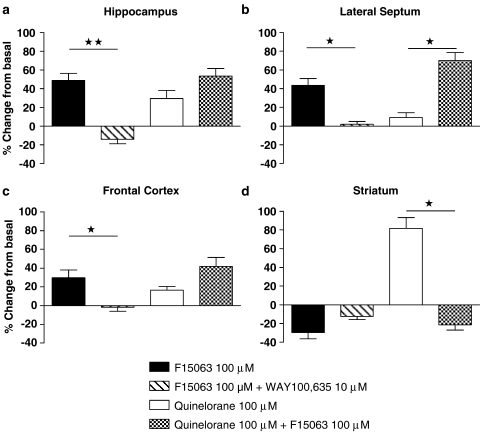
Figure 8.
F15063 increases 5-HT1A-mediated but blocks D2 receptor-mediated G-protein activation. Quantification of G-protein activation by F15063, as determined by [35S]GTPγS autoradiography, in (a) hippocampus, (b) lateral septum, (c) frontal cortex, (d) striatum. Bars represent the mean±s.e.m. values determined from quantification of autoradiograms of six animals. G-protein activation is expressed as percent changes from basal labelling. Statistical analyses were carried out by a Kruskall–Wallis test followed by Dunn's post hoc test. *P<0.05; **P<0.01.

