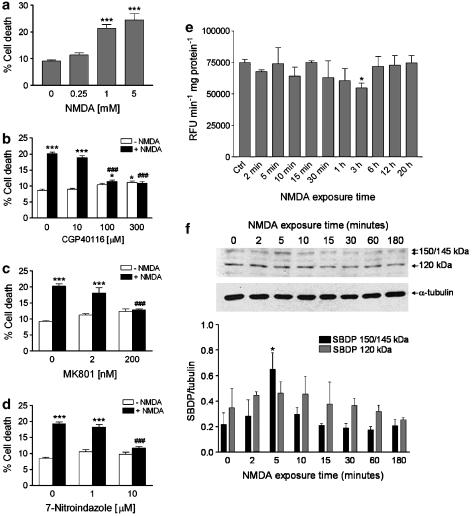
Figure 1.
Characterization of NMDA-induced cytotoxicity in SH-SY5Y cultures. (a) Treatment of SH-SY5Y cells with 1.0 mM NMDA for 24 h induces significant cytotoxic effects as assessed by trypan blue staining; no greater cytotoxicity was observed by incubating the cells with a higher concentration (5.0 mM) of the excitotoxin. A lower concentration (0.25 mM) of NMDA did not significantly affect cell viability. Cell death induced by NMDA (1 mM) was prevented by selective, (b) competitive (CGP40116; 100 and 300 μM) and (c) noncompetitive (MK801; 200 nM), antagonists of NMDA subtype of glutamate receptors. (d) 7-Nitroindazole (10 μM), a neuronal NOS preferring inhibitor, prevented death of SH-SY5Y cells induced by NMDA (1.0 mM). Each value in a, b, c and d is the mean±s.e.m. of 3–6 experiments. ***P<0.001 vs control; ###P<0.001 vs NMDA given alone (ANOVA followed by Tukey–Kramer multiple comparisons test). (e) NMDA does not increase caspase-3 activity in SH-SY5Y cell cultures. SH-SY5Y cells were exposed to 1 mM NMDA for the indicated periods of time, and then caspase-3 activity was determined in the supernatants of lysed cell suspensions by measuring cleavage of the fluorogenic substrate Ac-DEVD-AMC (see the Methods section). Results are expressed as relative fluorescence units (RFU) per min per mg of protein. Each value is the mean±s.e.m. of three experiments. *P<0.05 vs control (ANOVA followed by Dunnett multiple comparisons test). (f) Activation of calpain I after exposure of SH-SY5Y cells to NMDA. Representative Western blot showing the increase of the calpain-specific 150/145 kDa SBDP early after NMDA addition (1 mM). Note the lack of accumulation of 120 kDa α-spectrin fragment derived from caspase-mediated proteolysis. Histograms in lower panel show results of densitometric analysis of autoradiographic bands corresponding to 150/145 and 120 kDa SBDP. Data were normalized to the values for α-tubulin. Each value is the mean±s.e.m. of three experiments. *P<0.05 vs control (ANOVA followed by Dunnett multiple comparisons test).

