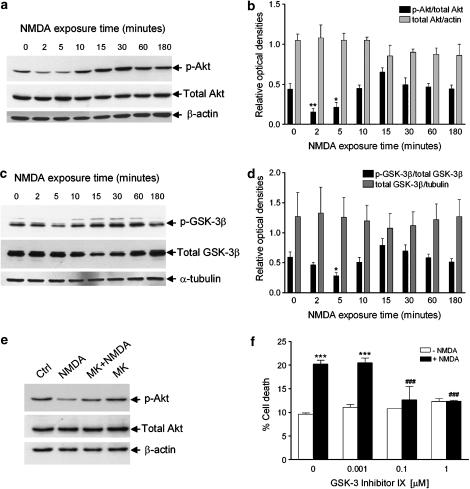
Figure 3.
Time course of NMDA effects on Akt and GSK-3β phosphorylation in SH-SY5Y cells and protection from NMDA-induced cell death by an inhibitor of GSK-3β kinase. SH-SY5Y cells were exposed to 1 mM NMDA for the indicated periods of time, then cellular proteins were extracted for subsequent analysis by Western blotting of Akt and GSK-3β phosphorylation by using a polyclonal antibody specific for (a) Akt phosphorylated at Ser473 and a polyclonal antibody specific for (c) GSK-3β phosphorylated at Ser9. To establish that changes in phospho-Akt (p-Akt) and phospho-GSK-3β (p-GSK-3β) levels are not due to changes in Akt and GSK-3β protein expression, nitrocellulose membranes were subsequently immunoblotted with an antibody specific for (a) total Akt and (c) total GSK-3β. Equal protein loading in each lane was confirmed by hybridization with an anti-β-actin (a) or anti α-tubulin antibody (c), for Akt anf GSK-3β blots, respectively. Histograms in (b) and (d) show the results of the densitometric analysis of autoradiographic bands; the data are reported as the ratio of (b) p-Akt/total Akt and (d) p-GSK-3β/total GSK-3β, whereas total Akt and total GSK-3β levels were normalized to the values yielded for β-actin and α-tubulin, respectively. Each value is the mean±s.e.m. of 3–6 experiments; *P<0.05 and **P<0.01 vs control, respectively (ANOVA followed by Dunnett multiple comparisons test). (e) MK801 (200 nM; MK), applied to neuroblastoma cultures 10 min before 1 mM NMDA, attenuated reduction of phospho(Ser473)-Akt (p-Akt) levels caused by 5 min exposure to the excitotoxin; a typical example, representative of three independent experiments, is shown. (f) GSK-3 inhibitor IX (0.1 and 1 μM) prevented death of SH-SY5Y cells induced by NMDA. GSK-3 inhibitor IX was added to SH-SY5Y cultures 30 min before NMDA application (1.0 mM) and cell death was evaluated 24 h later by trypan blue staining. No protection was afforded by the enzyme inhibitor applied at a lower concentration (0.001 μM). Each value is the mean±s.e.m. of 3–6 experiments. ***P<0.001 vs control; ###P<0.001 vs NMDA given alone (ANOVA followed by Tukey–Kramer multiple comparisons test).

