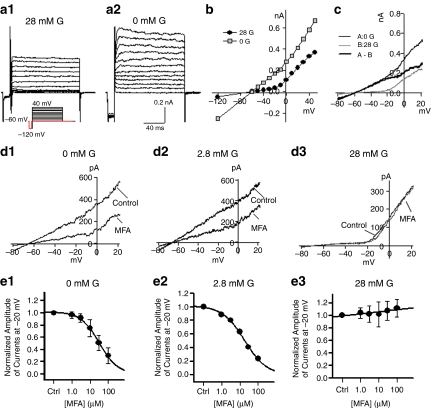
Figure 2.
MFA inhibits an NVDC that appears at low concentrations of glucose. All results shown in the figure were obtained by perforated patch recordings. (a) Typical traces of transmembrane currents evoked by changing VM with voltage-steps at 28 mM glucose (a1) and 0 mM glucose (a2), respectively, in the same cell. The inset in (a1) illustrates the VM-changing protocol. (b) Current–voltage (I–V) curves obtained by plotting the current (measured at 10 ms of the hyperpolarizing step of the first voltage-change swipe, and at 80 ms of each depolarizing step) against the voltage, at 0 or 28 mM glucose. Note that currents increase independently of the VM in the presence of 0 mM glucose, suggesting the development of an NVDC. (c) Shown are example I–V curves evoked by changing the VM using a voltage-ramp protocol. The curves were obtained from tests in the same cells at 0 and 28 mM glucose, respectively. The component of whole cell current mediated by the NVDC (dark trace) is isolated by subtracting the I–V curve at 28 mM glucose from the I–V curve at 0 mM glucose. This NVDC displays a linear I–V relationship. (d) MFA (100 μM) inhibits the NVDC that appears in cells bathed in 0 mM glucose (d1) and 2.8 mM G (d2). MFA (100 μM) has no effect on transmembrane current when the cell is exposed to high (28 mM) glucose (d3). (e) Dose–response curves showing the effect of MFA (1–100 μM) on transmembrane currents evoked in cells incubated with solution with 0 (e1), 2.8 (e2) and 28 mM glucose (e3). The currents were measured at −20 mV, because at this VM, the voltage-dependent current is small. The amplitudes of currents are normalized to the control (before addition of MFA).

