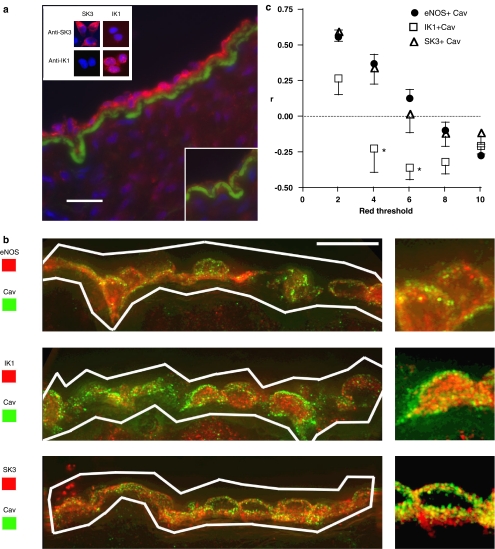
Figure 5.
(a) Detection and localization of IK1 in sections of porcine coronary artery. Anti-IK1 immunoreactivity (red), nuclei (blue) and internal elastic lamina (green) are shown (representative of n=4 animals). All scale bars are 12.5 μm. Negative control experiment with anti-IK1 antibody pre-incubated with antigenic peptide (inset bottom right). Antibody specificity control data showing HEK cells expressing SK3 and IK1 immunolabelled with anti-SK3 and anti-IK1 antibodies (inset top left; representative of three separate experiments). (b) Deconvolution microscopy images of porcine coronary artery sections co-labelled with anti-caveolin-1 (Cav) and anti-eNOS, anti-IK1 or anti-SK3 antibodies. Low and high power magnification images shown are histogram-equalized z-projections of 25-image stacks. White lines enclose endothelial areas included in the co-localization analysis. (c) Graph of co-localization analysis mean data (eNOS, n=100 images, four animals; SK3, IK1, n=75 images, three animals) showing Pearson's correlation coefficient (r) versus red threshold for anti-eNOS, SK3 or IK1 with anti-caveolin-1 immunoreactivity (r=+1 indicates perfect co-localization, r=0 indicates no correlation and r=−1 indicates perfect negative correlation). (For colour figure see online version.)

