Figure 3.
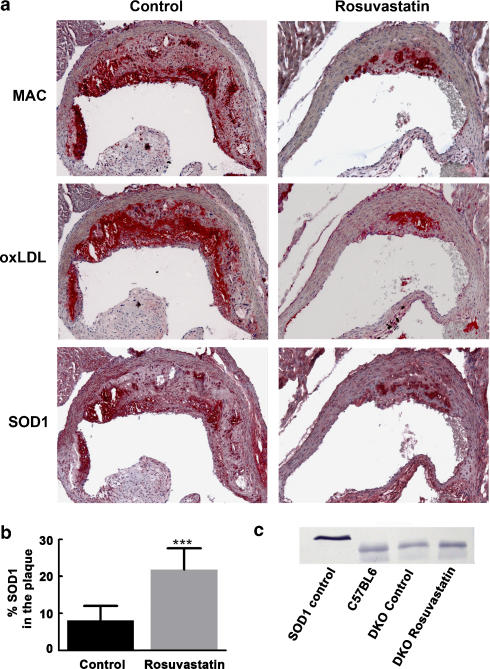
(a) Representative staining for macrophages (MAC), ox-LDL, and SOD1 in control and rosuvastatin-treated DKO mice showing co-localization of these three components (red=positive staining). (b) SOD1 area (as percentage of plaque area) in control and rosuvastatin treated DKO mice at 24 weeks. (c) Detection of SOD1 by Western blotting of human SOD1 control (23 kDa) and in extracts from the aorta of lean C57BL6 mice and in control and rosuvastatin treated DKO mice (19 kDa). ***P<0.001 compared to control DKO mice.

