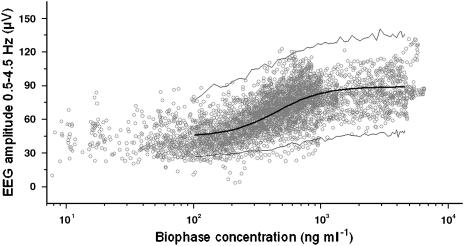
Figure 5.
PK–PD relationships of the opioids after hysteresis minimization with the extended catenary biophase distribution model. Observed (grey dots), population predicted (solid line) and 2.5 and 97.5% quantiles (dotted lines) are depicted versus the predicted biophase concentration as shown in Figure 4. The PK–PD relationship was obtained using the extended catenary biophase distribution model to describe the distribution to the effect-site and the sigmoidal Emax model to relate the biophase concentrations to the EEG effect.

