Figure 1.
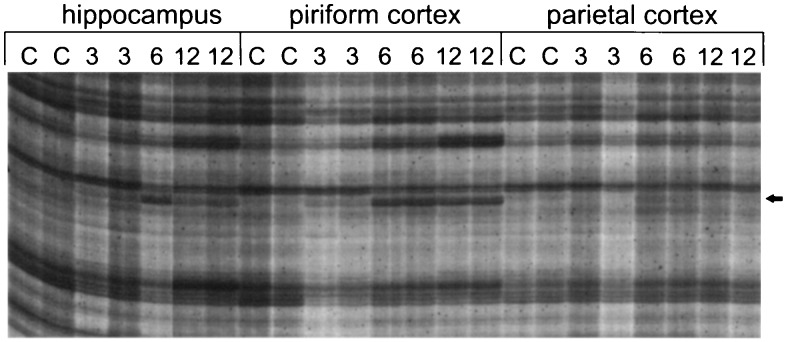
Differential display of mRNA comparing gene expression among hippocampus, piriform cortex, and parietal cortex after kainic acid administration. Only a portion of the autoradiogram is shown. C, 3, 6, and 12 denote control, 3 h, 6 h, and 12 h, respectively. Differential display reactions were performed in duplicate using 5′-TTTTTTTTTTTCG-3′ as an anchored primer and 5′-TACAACGAGG-3′ as a random arbitrary primer. The arrow indicates a reproducible PCR-amplified cDNA fragment that appears to be induced only in degenerating tissues (hippocampus and piriform cortex) at 6 and 12 h after kainic acid injection. In the hippocampus and piriform cortices, baseline levels of expression are seen in control animals and at the 3-h time point. By comparison, only baseline levels of expression are observed in the parietal cortex, a tissue in which seizure-induced neuronal degeneration is not observed.

