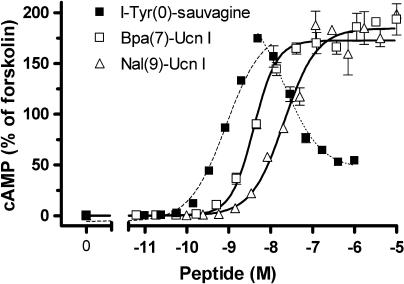
Figure 6.
Concentration–response curves for the intracellular cAMP accumulation in HEK-rCRF1 cells evoked by I-Tyr-sauvagine and the Gs-selective ligands Bpa(7)-Ucn I and Nal(9)-Ucn I. HEK-rCRF1 cells were stimulated by the peptides for 30 min. The cellular cAMP values were determined by radioimmunoassay and are given (mean±s.d. of triplicates) as percentage of the value obtained by stimulation by 10 μM forskolin. The curves were fitted by non-linear regression, for I-Tyr-sauvagine, separately for the stimulating and inhibiting portion of the bell-shaped curve. HEK-rCRF1, HEK293 cells stably transfected with rCRF1.

