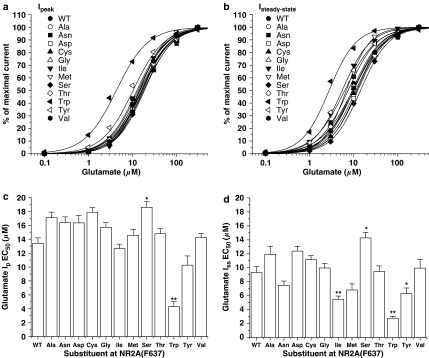
Figure 3.
NR2A(F637) mutations can alter EC50 values for both peak and steady-state glutamate-activated current. Concentration–response curves for glutamate (in the presence of 50 μM glycine) activation of peak (a) and steady-state (b) current in lifted human embryonic kidney 293 cells expressing NR1/NR2A or NR1/NR2A(F637) mutant subunits. Data points are means of five to eight cells and curves shown are the least-squares fits to the equation given in Materials and methods. Bar graphs show peak (c) and steady-state (d) EC50 values for glutamate in lifted cells expressing the various NR2A(F637) mutant subunits. Asterisks indicate EC50 values that differed significantly (ANOVA and Dunnett's test; *P<0.05, **P<0.01) from the EC50 for wild-type NR1/NR2A subunits.

