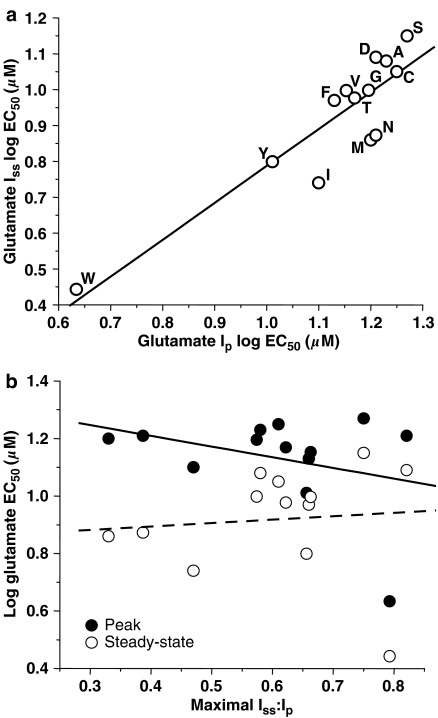
Figure 5.
Relation between NMDA-receptor agonist potency and desensitization in NR2A(F637) mutant subunits. (a) Graph plots steady-state vs peak EC50 values for glutamate in the various NR2A(F637) mutant subunits. Data points are labeled with the substituted amino acid for the various mutants at NR2A(F637). The line shown is the least squares fit to the data; glutamate peak and steady-state EC50 were significantly correlated (R2=0.900, P<0.0001). (b) Graph plots steady-state and peak log EC50 values for glutamate vs the Iss:Ip of glutamate-activated current in the various NR2A(F637) mutant subunits. Maximal Iss:Ip for glutamate was not correlated with either peak glutamate log EC50 (R2=0.340, P>0.05) or steady-state glutamate log EC50 (R2=0.075, P>0.05). The lines shown are the least squares fits to the data.

