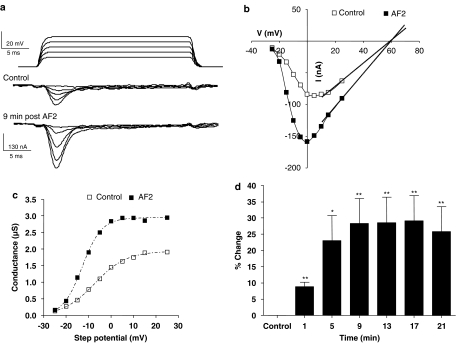
Figure 5.
Transient inward currents show long-lasting potentiation after a 2-min application of 1 μM AF2. (a) Voltage-gated transient-inward currents recorded before and 9 min after AF2 application. Note the increase in the amplitude of the peak inward currents. (b) Peak-current step–voltage relationship for experiment shown in (a) control and 9 min after AF2 application. Last three current points of each plot were extrapolated to obtain the reversal potential, +59 mV. (c) Activation curve showing increase in Gmax, a hyperpolarising shift in V50 and change in Kslope after AF2. (d) Long-lasting potentiation of the percentage change of the peak transient inward current after AF2 application (paired t-test, n=11 preparations from separate worms, **P<0.01,*P<0.05).

