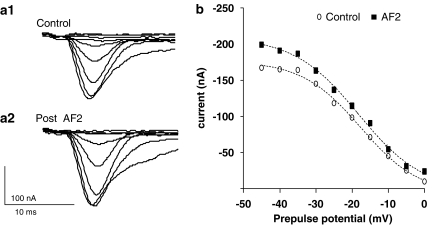
Figure 6.
Effect of 1 μM AF2 on the inactivation of the transient inward current. The transient inward currents were activated by a test pulse of 0 mV following 130 ms pre-pulses of 45 mV, −40, −35, −30, −25, −20, −15, −10, −5 and 0 mV. (a1) A trace of control transient inward currents at 0 mV step potential after the pre-pulses. (a2) Transient inward currents at 0 mV step potential after the pre-pulses and following AF2 perfusion. (b) Shows the plot of peak current against the pre-pulse potential; the points were fitted to the inactivation curve as described by Boltzmann's equation.

