
Figure 6.
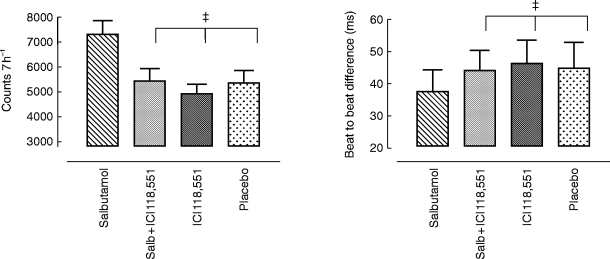
Effects on quadrant −/− (d: acceleration/acceleration) (over 7 h) counts and mean interval difference following placebo, salbutamol 8 mg, ICI 118,551 25 mg and salbutamol 8 mg plus ICI 118,551 25 mg. Statistics related to between group comparisons: non-parametric ANOVA followed by Wilcoxon’s rank sign test. ‡P < 0.01, all three vs salbutamol. Data are mean±95% confidence interval.