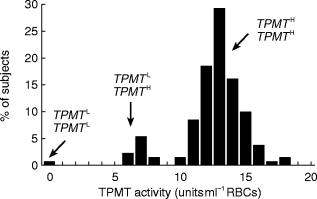
Figure 2.

Thiopurine methyltransferase (TPMT) genetic polymorphism. Frequency distribution histogram of TPMT activity in 130 unrelated control children. Presumed genotypes at the locus TPMT are shown. Leukaemic children who lack functional TPMT activity (extreme left of histogram) are acutely sensitive to MP ]30, 31[, whilst children with very high TPMT activities (extreme right of histogram) do not respond to standard dosages of MP ]28, 54[. Redrawn from ]28[.
