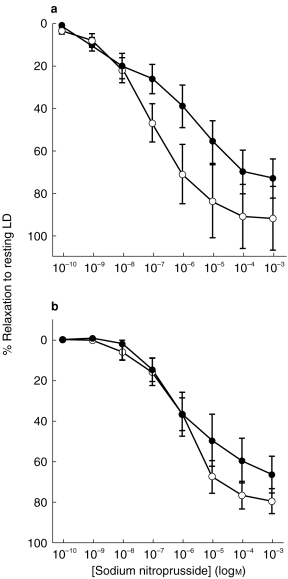
Figure 2.

Comparison between the relaxant response to SNP in subcutaneous resistance arteries, isolated from control subjects and RD patients preconstricted with NA (10−5 m): concentration-relaxation curves to SNP (expressed as percentage relaxation towards resting lumen diameter (LD)) at (a) 37° C and (b) at 24° C in vessels from control subjects (○; n=6) and RD patients (•; n=6). All values are mean±s.e.mean.
