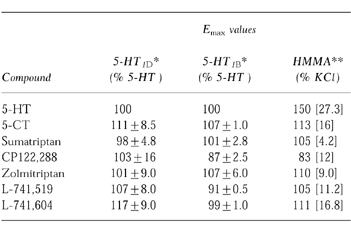
Table 2.
Measurements of the Emax values obtained for [35S]GTPγS studies for 5-HT1B/1D-receptors and human middle meningeal arteries. *For the cell line data values represent means derived from n = 2–3 experiments (±s.e.mean). Concentration-effect curves of percentage inhibition in binding above the basal for the [35S]GTPγS assay were plotted and analysed by non-linear, least squares regression analysis using an iterative curve fitting routine (Marquardt-Levenberg method). Emax values were expressed as a percentage of the maximal 5-HT (10 μm) response. **For human middle meningeal arteries values represent mean [asymptotic error] expressed as a percentage of the KCl (45 mm) evoked response derived from non-linear regression analysis. Curves were fitted to the overall mean data (n = 4–6).