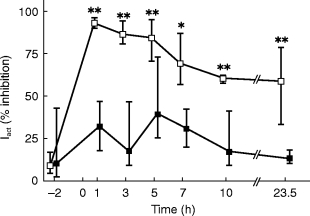
Figure 4.

Inhibition of phenylephrine infusion-induced elevations of diastolic blood pressure by 0.4 mg tamsulosin (filled squares) or 5 mg terazosin (open squares). Inhibition was calculated at each time point relative to the highest phenylephrine dose which was reached on both study days during active treatment and compared with the highest phenylephrine dose on the placebo day (‘Iact’, for calculation see Figure 1) and is shown as medians with upper and lower quartiles. * and **: P<0.05 and <0.01, respectively, vs tamsulosin in a Wilcoxon signed rank test.
