Figure 2.

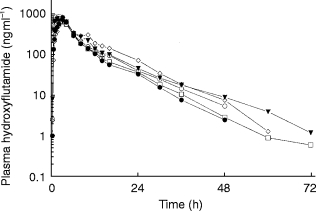
Mean plasma concentration-time profiles of hydroxy-flutamide in subjects with varying stages of renal failure following administration of a single 250 mg dose of flutamide. □ group 1, • group II, ◊ group III, ▾ group IV, ○ group V.

Mean plasma concentration-time profiles of hydroxy-flutamide in subjects with varying stages of renal failure following administration of a single 250 mg dose of flutamide. □ group 1, • group II, ◊ group III, ▾ group IV, ○ group V.