
Figure 5.
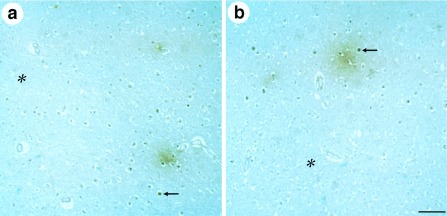
Immunohistochemical analysis of plaques in cortical sections of AD brains for α-p65 mAb immunoreactivity. Plaques are visualized by immunoreactivity (brown color). Examples of α-p65 immunoreactive cell nuclei (arrows) and surrounding plaques are depicted. Different examples for primitive plaque types are shown. Regions distant from plaques have reduced α-p65 immunoreactivity (asterisks). (Bar = 50 μm.)