
Figure 2.
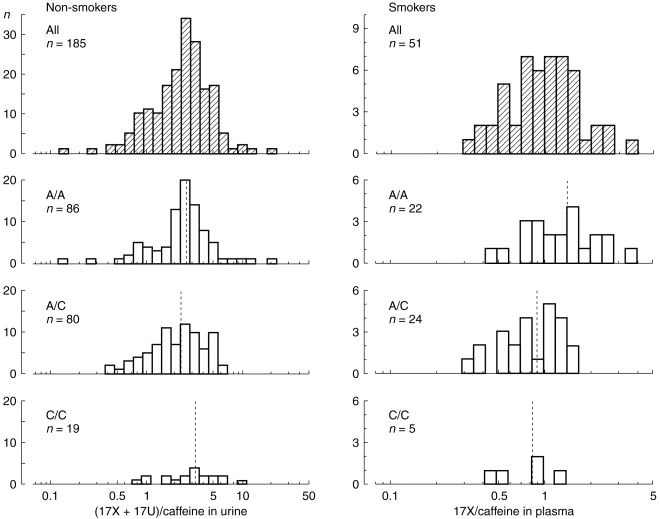
Frequency distribution of caffeine metabolic ratios in the different genotypes with respect to the CYP1A2 intron 1 polymorphism. On the left, logarithmically transformed molar urinary (17X+17U)/137X ratios from 185 non-smoking subjects are shown. There were no significant differences in the mean ratios between the three groups. On the right, the logarithmically transformed plasma 17X/137X ratios from 51 smokers are shown. In this group, the C/A polymorphism had a significant effect on the caffeine metabolic ratios (P=0.008). Dotted lines indicate the mean values in each group. The frequency distribution of each of the subgroups was not significantly different from a normal distribution according to the Shapiro-Wilk test.