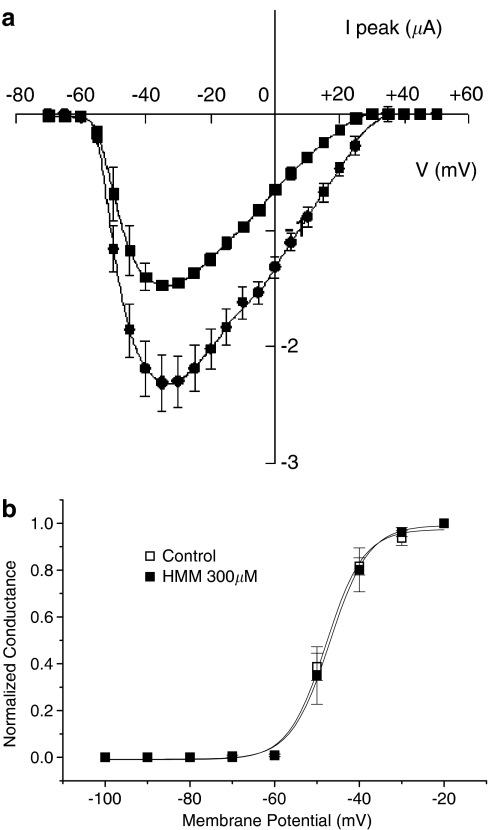
Figure 2.
(a) Typical current–voltage relationships (I/V curves) for INa recorded in the absence (filled circles) and in the presence of 300 μM HMM (filled squares). The voltage at which current amplitude was maximal (Vmax) was −33.3±1.7 mV in control and −35.0±2.9 mV in the presence of drug. Each data point shows the mean and s.e. of the mean for three fibres. (b) Steady-state activation curves constructed in the absence and in the presence of 300 μM HMM. Activation curves were fitted by Boltzmann equation, as described in Methods, with half-activation potential (Vx) value −46.9±0.4 mV in control and −44.9±0.6 mV in the presence of drug. Each data point shows the mean and s.e. of the mean for three fibres.

