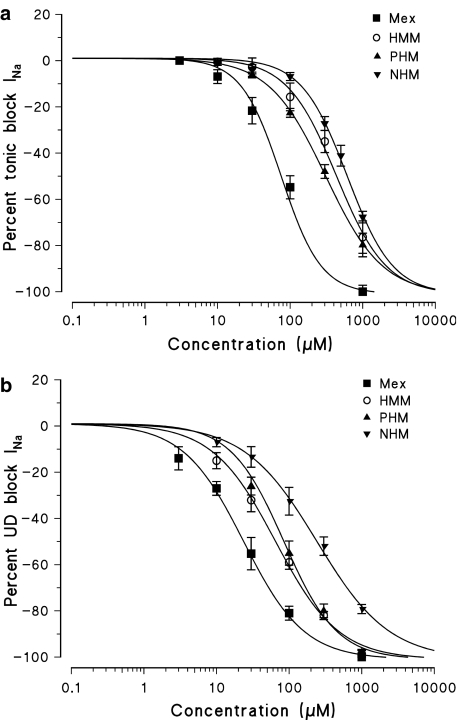
Figure 3.
Concentration–response curves for tonic (a) and 10 Hz use-dependent block (b) of Na+ currents obtained with Mex and its metabolites PHM, HMM and NHM. Each point shows the per cent block of INa observed in the presence of each concentration of drug versus INa in the absence of the drug in the same fibre and is the mean±s.e.m. from three to seven fibres. The curves fitting the experimental points were obtained using the logistic function described in Methods.

