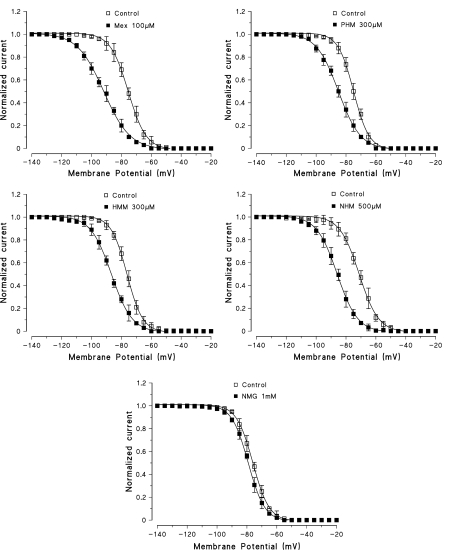
Figure 6.
Steady-state inactivation curves constructed in the absence and in the presence of Mex and of its metabolites. At each membrane potential is shown the current amplitude normalized to the INa max value obtained at −140 mV. Each point is the mean±s.e.m. from three to five fibres. Curves were fitted by a single Boltzmann distribution as described in Methods that allowed to calculate the Vh1/2. Owing to certain variability between controls, the effect of each metabolite, in terms of Vh1/2 and its shift, has been evaluated with respect to the control h∞ curve recorded in the same fibre. The calculated Vh1/2 for the curves shown in the figure are the following: Control, −75.4±0.1 mV and Mex 100 μM, −91.8±0.2 mV; Control, −74.9±0.2 mV and PHM 300 μM, −85.1±0.2 mV; Control, −76.3±0.2 mV and HMM 300 μM, −86.7±0.2 mV; Control −71.2±0.2 mV and NHM 500 μM, −85.9±0.2 mV; Control, −76.0±0.1 mV and NMG 1 mM, −79.1±0.1 mV. The values of Vh1/2 in the absence and presence of each compound are as mean±s.e.m. from three to five fibres. The mean values of K, as estimate of the slope factor of the curves shown in the figure and derived from the fit, are as follows: Control, 0.18±0.002 and Mex 100 μM, 0.12±0.002 (n=4; P<0.001); Control, 0.21±0.02 and PHM 300 μM, 0.19±0.02 (n=5; NS); Control, 0.2±0.01 and HMM 300 μM, 0.11±0.01 (n=3; P<0.001); Control, 0.19±0.004 and NHM 500 μM, 0.18±0.01 (n=4; NS); Control, 0.21±0.01 and NMG 1 mM, 0.19±0.003 (n=3; NS).

