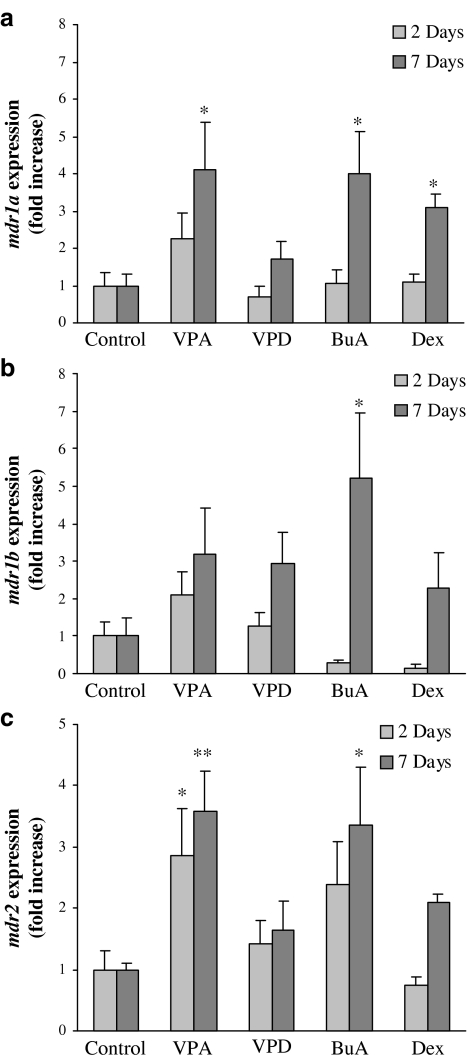
Figure 6.
Quantitative PCR determination of mdr1a (a), mdr1b (b) and mdr2 (c) mRNA copy numbers in the livers of control and treated rats. Rats were treated with valproic acid (VPA; 144 mg kg−1 b.i.d.), valpromide (VPD; 143 mg kg−1 b.i.d.), butyric acid (BuA; 600 mg kg−1 b.i.d.), dexamethasone (Dex; 50 mg kg−1 b.i.d.) or methylcellulose (control). The relative copy number of mdr1a, mdr1b and mdr2 was determined by quantitative real-time PCR and normalized by the amount of GAPDH. Results are expressed as fold increase in the copy number, compared to control (mean±s.e.m.). *Significantly different from control, P<0.05. **Significantly different from control, P<0.01. n=5 or n=7 in the 2- or 7-day treatment groups, respectively.

