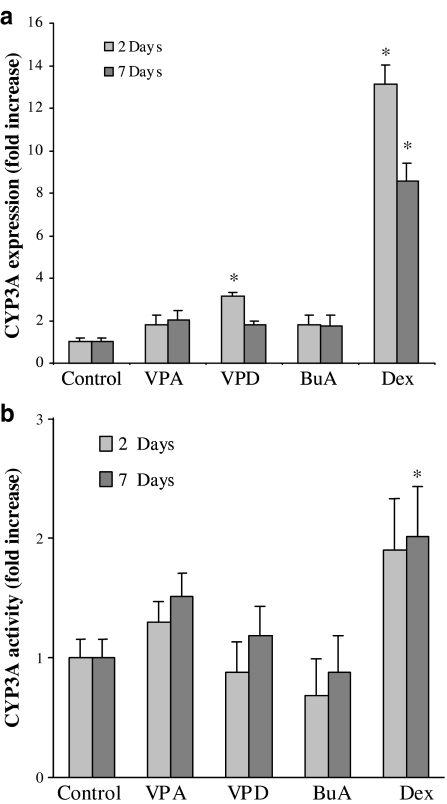
Figure 7.
Hepatic enzyme expression and activity in the livers of control and treated rats. (a) Relative amount of CYP3A mRNA. The amount of CYP3A was determined by Northern blot analysis and normalized by the amount of cyclophyllin. Results are expressed as fold increase in the copy number, compared to control (mean±s.e.m.). (b) Microsomal CYP3A activity. Testosterone was used as the substrate for CYP3A. *Significantly different from control, P<0.05; n=5 or n=7 in the 2- or 7-day treatment groups, respectively.

