
Figure 4.
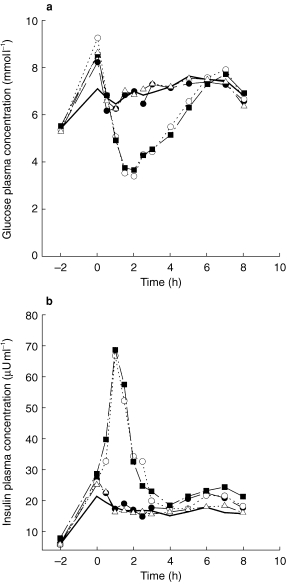
a) Plasma glucose concentration-time course (mean±s.d.) during the respective treatments A (thioctic acid, •), B (glibenclamide, ○), C (TA+glibenclamide, ▪) and D (TA+acarbose, ▵). It should be noted that a number of volunteers needed extra glucose >2 h after glibenclamide dosing (see Methods). b) Plasma insulin concentration-time course (mean±s.d.) during the respective treatments A (thioctic acid, •), B (glibenclamide, ○), C (TA+glibenclamide, ▪) and D (TA+acarbose, ▵), — baseline.