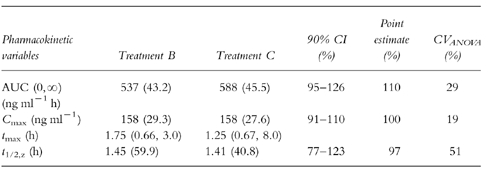
Table 2.
Pharmacokinetic variables of glibenclamide (geometric mean (CV%) with the exception of tmax which is given as median with minimum and maximum) for the respective treatments glibenclamide alone (B) and thioctic acid+glibenclamide (C) as well as 90% confidence intervals (90% CI), point estimates, and intraindividual variabilities (CVANOVA; parametric analysis, two one-sided t-tests) for glibenclamide from treatment B/C.