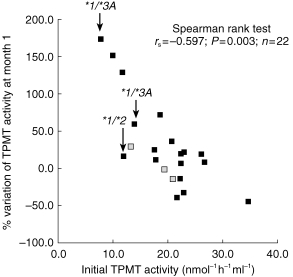
Figure 1.

Correlation between initial TPMT activity, measured on the day of transplantation (day 0) and the percentage change after the first month of azathioprine treatment. TPMT genotype is quoted for the three heterozygous patients ( : genotype not available).
