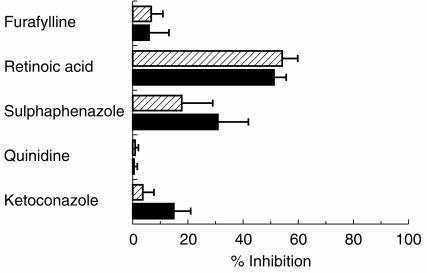
Figure 5.
The effect of various selective P450 inhibitors on rosiglitazone para-hydroxylation (hatched bars) and rosiglitazone N-demethylation (solid bars) in human liver microsomes. Values are illustrated as mean percentage inhibition±s.d. (error bars) in human liver microsomes (n=3 with 13-cis retinoic acid, quinidine, ketoconazole); (n=4 with furafylline); (n=6 with sulphaphenazole).

