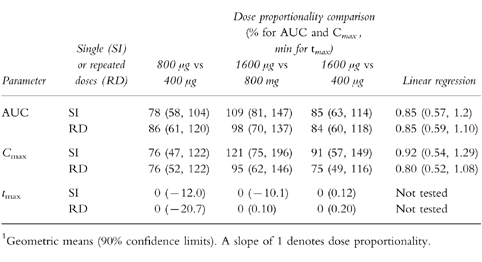
Table 3.
Dose proportionality comparisons of pharmacokinetic parameters, based on metered doses and expressed as geometric means and (within brackets) 90% confidence limits. Pairwise comparisons of Cmax and AUC were tested by anova on dose-normalized log data. A Wilcoxon test was used for pairwise comparisons of tmax. Dose proportionality was also tested by linear regression of log data.

