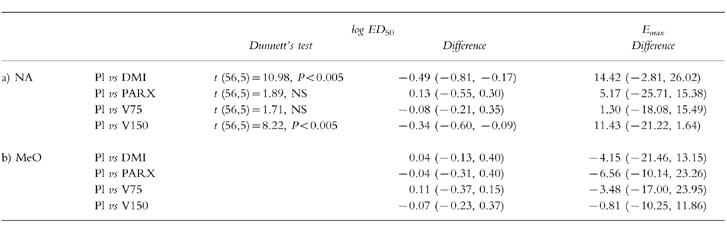
Table 2.
Comparison of the parameters of the dose–response curves to (a) noradrenaline (NA; log ED50: ng min −1, Emax: %) and to (b) methoxamine (MeO; log ED50: μg min −1, Emax: %), in the presence of placebo and the active drug treatments (c.f. Figure 2). Dunnett’s test ( d.f., k) in case where there was a significant treatment main effect (see text for details); differences (mean, 95% CI, n =15) between placebo and active treatments.