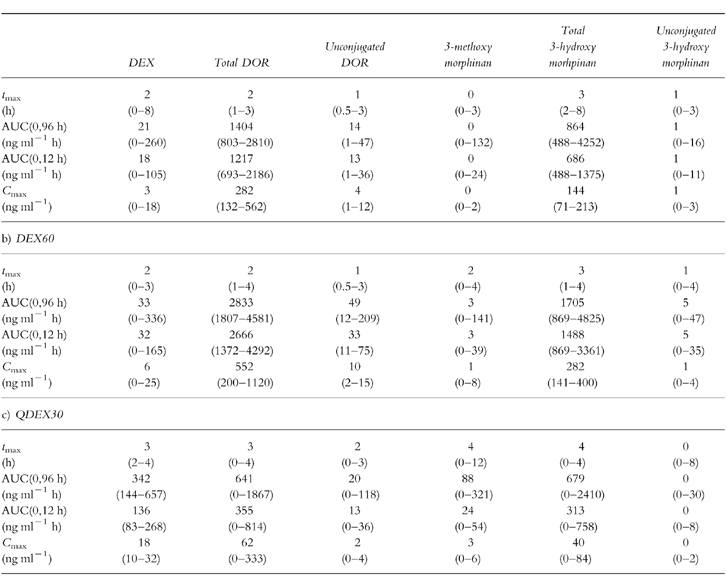
Table 1.
Pharmacokinetic parameters of DEX and its metabolites according to treatment group. [Data are median values; range is given in parenthesis. Cmax = maximum plasma drug concentration; tmax = time to reach Cmax = AUC(0, 96 h) = area under the plasma drug concentration-time from 0 h to 96 h; AUC (0, 12 h) = area under the plasma drug concentration-time curve from zero to 12 h]

