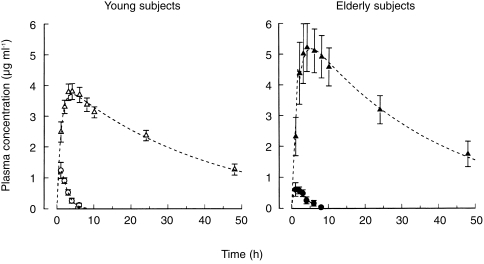
Figure 1.

Plasma concentrations of allopurinol (○, •) and oxipurinol (▵, ▴) after oral administration of 200 mg allopurinol to elderly (solid symbols) and young subjects (open symbols). The dashed curves were calculated by nonlinear regression analysis underlying Equation (4). Values are means±s.e. mean.
