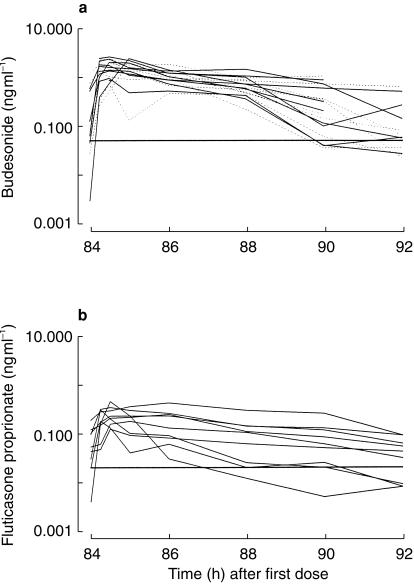
Figure 1.
a) Individual concentration data for BUD 22R-and 22S-epimers (solid line and dashed line, respectively) on the 5th day of 1600 µg twice daily via pMDI. The horizontal line represents the LOQ at 0.05 ng ml−1. b) Individual concentration data for FP on the 5th day of 1000 µg twice daily via pMDI. The horizontal line represents the LOQ at 0.02 ng ml−1. The peak concentrations obtained after BUD were greater than after FP.

