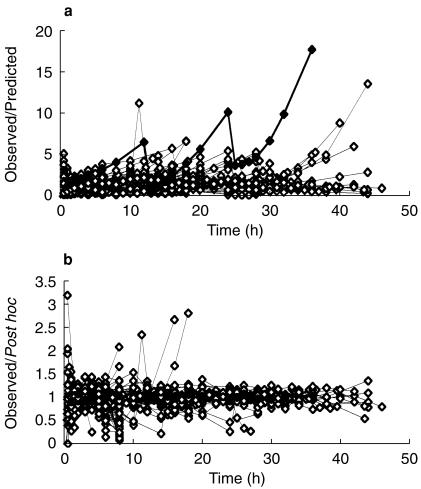
Figure 1.
Quality of fit of pharmacokinetic pooled analysis for all children over the study time. The y-axis of each panel displays the ratio of measured concentrations to those predicted from pharmacokinetic analysis. The upper panel 1a displays values from the population parameters. The lower panel 1b displays values from NONMEMs post hoc step based on values of the parameters for the specific individual. Subject 16 is shown as filled triangles to show the quality of the post hoc fit compared to the population fit.

