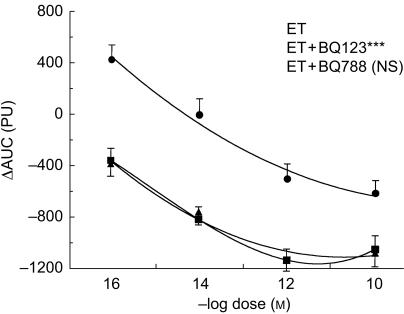
Figure 2.
Dose–response curve of endothelin-1 (ET) alone (▪) and in the presence the ETA-selective antagonist BQ-123 (ET + BQ-123, •) and the ETB-selective antagonist BQ-788 (ET + BQ-788, ▴) in the human skin microcirculation. ⋆⋆⋆ P < 0.001 vs ET; NS not significant. ΔAUC: Area under the curve of the time-response to each constrictor. PU: perfusion units.

