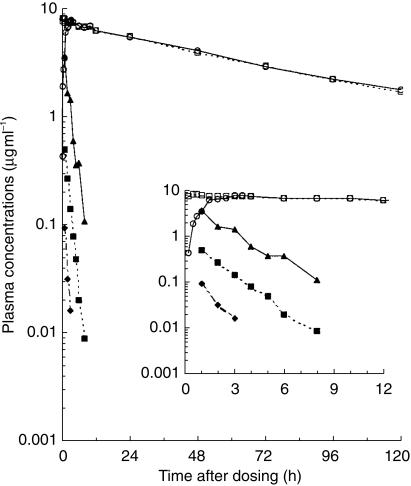
Figure 3.
Mean concentrations of NTBC and mesotrione in plasma following oral administration of either NTBC (○ 1 mg kg−1 bodyweight in solution; □ 1 mg kg−1 body weight in capsule) or mesotrione (♦ 0.1 mg kg−1 body weight; ▪ 0.5 mg kg−1 body weight; ▴ 4 mg kg−1 body weight). Inset graph shows the concentration data at early time points. For clarity, error bars have not been included.

