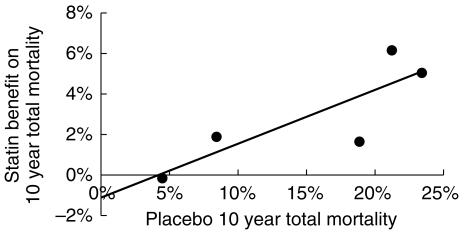
Figure 5.
Statin net mortality benefit plotted against placebo group mortality for the outcome trials. The line of best fit intersects the x-axis at a 10 years death risk of 4.5%. This estimate may be biased by regression dilution (see text and [13]).

