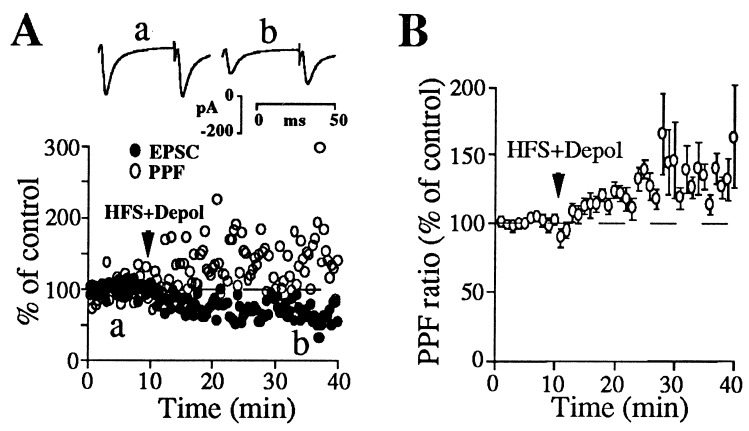
Figure 3.
Striatal LTD is closely associated with increases in PPF ratio. (A Upper) Paired EPSCs recorded at the indicated times before and after LTD induction. (Lower) EPSC peak amplitude and PPF ratio from the same neuron plotted against time before and after LTD induction. (B) Summary graph showing increases in PPF ratio after LTD induction (n = 11). PPF ratio after LTD induction was 137.9 ± 7.3% of control. Note that the change in PPF ratio associated with LTD expression is similar to that observed after decreasing Ca2+/Mg2+ ratio in the external solution (see Fig. 2A). Waveforms in A are averages of 20 individual paired EPSCs. Points in B are values averaged over 1-min time epochs.

