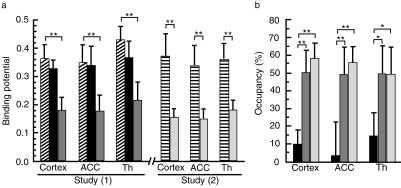
Figure 3.
ROI-based analyses of BPs and H1-receptor occupancies in the cortex, anterior cingulate cortex (ACC) and thalamus (Th) after antihistamine treatments. (a) In study 1, the comparisons of BPs are shown among the control ( ), ebastine (▪) and (+)-chlorpheniramine 2 mg (
 ) groups. In study 2, the BP values are compared between the placebo (
 ) and (+)-chlorpheniramine 6 mg (
 ) treatment groups. (b) H1-receptor occupancies by antihistamines (ebastine ▪; (+)-chlorpheniramine 2 mg
  ; and (+)-chlorpheniramine 6 mg
  ) are shown when the occupancy in the control or placebo group is regarded as 0%. *P< 0.01 and **P< 0.001, statistically analysed by Dunnett's multiple comparison test or by Student's t-test.

