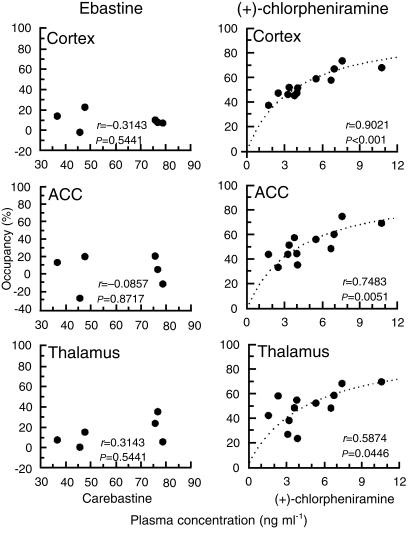
Figure 4.
Relationships between H1-receptor occupancies in the cortex, anterior cingulate cortex (ACC) and thalamus and plasma drug concentration. The x-axis of the ebastine group is plasma carebastine concentration. Correlations were statistically analysed by Spearman's rank correlation test (P < 0.05: statistical significant). Dotted curves reflect the estimated curves of relationships between plasma concentration and the receptor occupancy analysed by the Michaelis–Menten equation.

