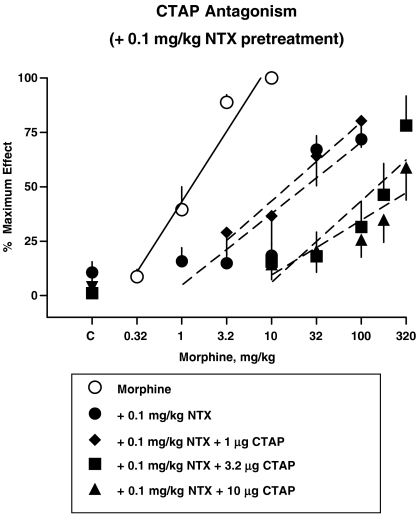
Figure 3.
Effects of CTAP i.c.v. in the presence of a fixed dose of 0.1 mg kg−1 naltrexone s.c. Naltrexone s.c. and CTAP i.c.v. were coadministered 25 min before determination of the morphine dose–response curve. Points above C are the effects of CTAP alone or the effects of CTAP in combination with naltrexone alone. Each point represents the mean of one observation in 6–8 rats. Other details as in Figure 1.

